Minggu, 31 Oktober 2010

Option GLD Nov (Weeklys)

Order Entry GLD Untuk Senin Before Open

Penutupan Gold pada hari jumat kemarin terlihat Moving Average 5 day telah membentuk formasi gendong pada Bullish candle (Strong Uptrend), maka kita perlu melakukan strategy plan untuk trading Gold kedepan, berikut perincian peta peperangan untuk besok:


Setelah kita merencanakan skenario peperangan untuk besok maka selanjutnya kita akan menuju menu monitor trade untuk melakukan perhitungan lebih detail lagi.

Berikut ini adalah penjabarannya:


Dengan perhitungan yang telah kita lihat diatas, maka kita akan melakukan:

SOLD -6 VERTIKAL GLD 100 (Weeklys) NOV1 135/137 CALL

Dengan melakukan strategy Vertikal maka uang modal yg ditahan senilai $984,00 dan uang cash yang masuk senilai $188,05

GLD = $188,05 / $984,00 x 100
= 19,11%

Dalam perdagangan Gold minggu depan kita memperoleh persentase provit cukup banyak yaitu 19,11%

GLD Double Breakout $132

Membahas Saham Gold (GLD)

Pada hari Jumat Pembukaan bursa saham Wallstreet kemarin GLD di buka pada harga $131.48, 15menit pertama pada sesi pembukaan GLD sempat turun sampai menyentuh harga $131.07.

Sebagai bandar (pemberi sewa option) jelas kita tidak menginginkan GLD sampai menembus harga $132, Dengan menyewakan option dengan posisi

SOLD 4LOT Vertikal GLD 100 OCT 132/135 CALL

Maka kita akan membutuhkan strategy plan agar kita dapat exit dengan melakukan buyback sebelum GLD menyentuh harga $132. Maka kita tarik garis resistant pada harga $131.85, tindakan ini untuk mencegah kita dari resiko kebangkrutan segabai bandar jika GLD sampai menyentuh harga $132.

selanjutnya kita lihat grafik dibawah ini:


Di grafik telah kita lihat pada pukul 22.37 kita melakukan BUY BACk karena saya telah membuat pola garis trading sehingga kita tahu arah market ini akan kemana.

Trendline merupaka faktor penting dalam setiap keputusan dalam suatu pergerakan, berikut adalah history esksekusi options GLD:


Kita lihat diatas pada hari senin kita mulai menyewakan options GLD 132/135 CALL seharga $244,00 lalu pada hari jumat kita membeli kembali option GLD 132/135 CALL seharga -$64,00

Jadi setelah melihat account statement diatas kiat mendapatkan provit dari GLD sebesar:

GLD = $244 - $64
= $180 atau Rp. 1.500.000/week (Modal ditahan sekitar $1000)

Trading plan yang telah kita jalankan apakah bisnis ini cukup menjanjikan atau bahkan masih kurang menjanjikan itu saya kembalikan pada anda...

Keputusan ada pada Anda :)

INT

How To Trade The Advance Block

Commodity trading software is less effective without candlestick signals

Commodity trading software is not very effective if price trends cannot be analyzed. Whether using commodity trading software for executions, or for an analysis of commodity trends, without candlestick signals the software becomes much less effective. Keep in mind, candlestick signals were developed while trading the most basic of commodities. Rice! Japanese Rice traders analyzed and observed signals that would reoccur in price trends. Through the centuries, reversal signals and continuation patterns were discovered to work very effectively. These patterns incorporated the recognition of consistent and predictable investor thought processes. Most computer trading software does not allow the instant determination of a reversal in a price trend.

Learning how to use candlestick signals effectively will eliminate any use of commodity trading software. The analysis that can be provided by candlestick signals has one great benefit. The human mind can calculate what other outside influences might be affecting a commodity price. This is something that most commodity trading software cannot do. Being able to incorporate the knowledge that is provided by the candlestick signals while also interpreting what other outside influences may be doing to a price has huge benefits.

Having the ability to analyze whether a reversal is occurring is the primary function of technical analysis. Most commodity trading software does not have the inherent analytical processes to consistently produce profitable trading results. Utilizing candlestick signals puts the probabilities in the investor's favor. This analysis can be applied to all commodity trades as well as stock trades. Do not depend on commodity trading software. Learning how to use candlestick signals successfully will permit any investor to successfully trade in any market in any condition. Learn the signals! They have already been proven for over four centuries of studies providing a strong statistical base.

ADVANCE BLOCK


Description

The Advance Block is somewhat indicative as the Three White Soldiers but it is a bearish signal. Unlike the Three White Soldiers, having consistent long candles, the Advance Block shows signs of weakness. The bodies are diminishing as prices rise and the upper shadows becoming longer indicate that the bulls are getting more resistance from the bears. This pattern is going to occur in an up-trend or occurs during a bounce up in a downtrend. It is visually obvious that the rise is losing its power.

Criteria

1. Each white candle occurs with higher closes.
2. The opens occur in the previous day’s body.
3. The bodies are getting smaller and/or the upper shadows are getting longer.

Pattern Psychology

After an up trend or a bounce up during a long downtrend, the Advance Block will show itself with an initial strong white candle day. However, unlike the Three White Soldiers, each proceeding day becomes less strong. If the bulls try to take the prices up, the bears step in and take them back down. After three days of waning strength, the bears should confirm the reversal with further deterioration.

How To Trade The Deliberation

Beginning investing in the stock market made easy with candlestick signals

Beginning investing in the stock market is usually an overwhelming process. Investors try to research a multitude of investment methods. Trying to single out an effective investing program can be very difficult. But, there is one investment method that makes beginning investing in the stock market very easy to understand. Candlestick signals! Candlestick signals incorporate one very simple element. They are formed by the cumulative knowledge of everybody that was buying or selling that trading entity during a specific time period. This makes beginning investing in the stock market much easier to comprehend.

The candlestick signals have been a time-tested investment method, the results of centuries of observations. Japanese Rice traders became legendarily wealthy utilizing the information provided by candlestick reversal signals. Not only did the visual recognition of the signals become important, understanding why those signals were formed became invaluable information. Having the knowledge of why a reversal signal is forming provides the insights for understanding market trends. It allows an investor to eliminate the biggest hurdle for somebody beginning investing in the stock market. Emotions!

Investment patterns in the market are easily recognized. Investors throughout the centuries and throughout the future centuries will have the same emotional based thought processes when it comes to investing. The fear and greed factor. Candlestick signals are clear visual graphic depictions of those emotions. Learning what the signals represent produces a huge advantage for the candlestick investor. Learning the 12 major signals and the secondary signals produces a tremendous benefit for anyone just beginning investing in the stock market. It greatly reduces learning the wrong investment techniques to which most new investors are exposed . Learn how to use the candlestick signals effectively and you'll have control of your investment future for the rest of your life.

Start your education beginning investing in the stockmarket with candlestick signals and their proper usage by reviewing the 12 Major Candlestick Patterns, all Secondary reversal signals, and the Continuation Patterns. Check back each week as we add new signals and patterns to continue your candlestick education.

DELIBERATION


Description

Another pattern close to the Three White Soldiers pattern is the Deliberation pattern. It is formed by two long white bodies. These are followed by a small white candle. This last candle may have opened at or near the previous day’s close or it may have gapped up. The Japanese say that this is the time for deliberation. The slow down in the advance is time for the bulls to get out.

Criteria

1. The first two white candles are relatively equal long candles.
2. The third day is a small body.
3. The small body opened at or very near the previous day’s close. Or it may have gapped up slightly.

Pattern Psychology

After an up trend or a bounce up during a long downtrend, the deliberation signal can occur. Like the Advance Block signal, this pattern also represents buyer weakness. In this case, it shows the weakness in one day. This pattern is slightly more difficult to recognize than the Advance Block Pattern.

How To Trade The Upside Gap

Hot stock market picks are better identified when using candlesticks signals

What is every investor looking for? Hot stock market picks!!! Everybody wants to find the stock that is going to make them wealthy. Hot stock market picks is the Golden Goose that all investors try to find. Is there a system for finding hot stock market picks? Not really, but one of the best investment tools for finding the hot stock market picks is candlestick signals. The signals do not necessarily identify hot stock market picks, they simply put investors into positions that have a high probability of producing big-profit moves.

Candlestick signals identify where money is flowing into and out of stocks/sectors. Being able to identify and understand the investor psychology that creates the candlestick signals produces a huge advantage. It allows an investor to participate in stock investments that have an extremely high probability of moving in the right direction. The signals are created by common sense investment practices. Trying to identify hot stock market picks is a longshot. However, utilizing candlestick signals dramatically increases the probabilities of being in a strong price move. The signals have been developed through hundreds of years of visual analysis. When investor sentiment starts turning, the Japanese Rice traders identified the signals that illustrated the change.

The point of investing is to put investment funds into situations that have the highest probabilities of making money. Will there be failed trades? Of course, and the candlestick signals reveal when to get out of those trades very quickly. Will candlestick signals put investors into hot stock market picks? The candlestick signals do not identify the hot stock market picks, they put investors funds into trading patterns that increase the probabilities of participating in big price moves when they occur. Utilizing the signals correctly will dramatically improve the probabilities of being in the right place at the right time. Use to your advantage. Learn the 12 major signals well and you'll understand why prices move. Be aware of the secondary signals because they can also produce the evaluation of whether to get in or stay in positions.

Trading the Upside Gap Two Crows Pattern


Description

The Upside Gap Two Crows is a three-day pattern. The upside-gap is created between the long white candle at the top of an uptrend and the small black candle of the second day. The black candle gaps open and pulls back before the end of the day. Even though it has pulled back, it did not fill the gap. The third day opens above where the first black candle opened. It can not hold at these levels and pulls back before the end of the day. Closing lower than the previous day, it has engulfed the small black candle's body. However, it still did not close the gap from the white candle.

Criteria

1. A long white candle continues the uptrend.
2. The real body of the next day is black while gapping up and not filling the gap.
3. The third day opens higher than the second day's open and closes below the second day's close. This produces a black candle that completely engulfs the small black candle.
4. The close of the third day is still above the close of the last white candle.

Pattern Psychology

After a strong uptrend has been in effect, the atmosphere is bullish. The price gaps open but cannot hold the gains. Before the end of the day, the bears step in and take the price back down. However, the gap up from the white candle was not filled. The next day, the bulls try again; they open the price higher than the open of the previous day. Again, they cannot hold the price up. It backs off and closes lower than the previous day. This now has taken all the steam out of the bulls. At this point, you will want to see the bears really stepping in the next day to confirm the reversal. (This pattern is not as bearish as the Two Crow Pattern)

How To Trade The 3 White Soldier

Commodity trading charts easy-to-read with candlestick signals

Commodity trading charts are very easy to read using candlestick signals. Commodity trading charts are very important for investors using higher leveraged commodity trades. Candlestick signals clearly illustrate where reversals occur in price trends. They work more effectively on commodity trading charts than they do on stock trading charts. Commodity trading charts usually reveal a long and sustained trend. Commodities trade differently than stocks. They have less outside influences to affect the price trend. Candlestick signals reveal when these trend changes are occurring.

Commodity prices do not have numerous factors that will change a price trend. Most of the time, commodity prices move basically on supply and demand issues. That is the true nature of free markets at work. Candlestick signals pinpoint when a change of a major trend is going to occur. Investor sentiment is the true gauge for identifying when supply and demand is changing course. The Japanese Rice traders made fortunes trading the most basic of commodities, Rice. The information that is conveyed by the individual candlestick signals produces recognized formations. These formations/signals have not only been identified by Japanese Rice traders, they were able to evaluate what the investor sentiment was doing at these reversals. This information is very valuable when analyzing commodity trading charts. The same information is easily applied to any trading entity. Investor decisions remain constant throughout the centuries. Fear and greed become a vital part of the movement of prices.

Commodity traders gain a huge advantage when able to recognize reversal signals. The most proven and tested reversal signals are candlestick signals. They have been utilized successfully for centuries. Having a visual pattern that demonstrates the change of investor sentiment is a valuable cool. An investor that can recognize the reversal signals to have worked effectively for centuries improves their probabilities of being in the right trade at the right time. Each of the signals has advantageous elements. Whether a major signal or a secondary signal, applying candlestick analysis to commodity trading charts will dramatically improve an investor's profits. Learn how to interpret these simple reversal signals, and the probabilities become greatly enhanced in the investor's favor.

This Secondary Signal, The Three White Soldiers, is one of many strong reversal patterns.

Three White Soldiers


Description

The Three White Soldiers (also known as The Advancing Three White Soldiers) is a healthy market reversal pattern. It consists of three white candles, the second and third candles opening lower than the previous close but closing at a new high.

Criteria

1. Each consecutive long candle closes with a higher open.
2. The second and third candlesticks open in the previous day's body.
3. Each day should close very near its high for the day
4. The opens should be within the top half of the previous day's body.

Pattern Psychology

After a downtrend or a flat period, the presence of this formation suggests a healthy rally will occur. The strength of this formation consists of the fact that each day, the lower open suggests that sellers are present. By the end of each day, the buying has overcome the early sellers. This represents that a healthy continued rally has selling occurring as it is happening. As in any rally, too much buying with little selling can be dangerous. This Bullish reversal pattern needs no confirmation.

How To Trade The Stick Sandwich

Reading Stock Charts - The 'Stick Sandwich'

Reading a stock chart can be overwhelming at first glance. Candlestick Signals and patterns make reading a stock chart quick and easy. A brief look at Stock Investing Basics with Candlesticks, shows the visual comparison between reading stock charts with Candlesticks versus Bar Charts.

Individuals new to trading the stock market have a number of decisions to make regarding their chart preferences. Choosing Candlestick Charts, versus 'Bar charts,' makes for a quicker evaluation of price trends. Reading a stock chart in the 'Bar' format makes it very difficult to interpret impending price reversals. Identifying stock chart reversals, continuations, and consolidation is paramount when reading a stock chart. Even professional investors are taking courses to trade with Japanese Candlesticks. That should tell you the importance of using candlesticks for reading stock charts.

Candlestick charting provides a quick graphic depiction easily learned by new investors. Bar charts illustrate what price movements did during a specific timeframe. Reading a stock chart, displayed with candlesticks, reveals HOW and WHY the price moved. Fundamentals do not make price moves. Investor perception determines the underlying price and Candlestick Signals clearly demonstrate investor sentiment. This provides valuable insight when reading a stock chart. The ability to evaluate trades with profitable entry and exit strategies will make-or-break your portfolio. Reading a stock chart accurately is the first step for investor education. Our website is designed to help all investors learn to read Candlestick Signals and Candlestick Chart Patterns. Pages are in a printer-friendly format to allow you to print the illustration and trading criteria for quick reference during your trading day.

Be sure to begin your training with our Free Resources Section on The Major Candlestick Signals.

STICK SANDWICH


Description

The Stick Sandwich looks somewhat like an ice cream sandwich. it consists of two dark candles with a white candle in between. The closing prices of the two black candles are equal. This demonstrates an obvious support price. The probability of a reversal in the trend is high from this area.

Criteria

1. A downtrend is concluded with a large black candle followed by a white candle. The white candle opens above the black canldes close, and closes above the black candle's open.
2. The final day completely engulfs the white candle and closes at the same level as the previous black candle.

Pattern Psychology

The Bears have been in control for awhile. At the end of the downtrend, the last black candle is followed by a large white candle. The white candle opens higher than the lcose ofthe last black candle. It trades up for the rest of the day, closing above where the previous day opened. This action makes apparent to the Bears that the downtrend may be coming to an end. The next day opens higher but trades down for the rest of the day. It cannot close lower than the previous low close of two days prior. The shorts take notice and start covering upon any buying strength over the next couple of days.

How To Trade The Homing Pigeon

Predicting Stock Market Trends

Why is it so difficult to predict stock market trends? Just look at two of the ‘indicators’ some investors use for predicting stock market trends.

Some people put their faith in the “January Barometer”. A theory that the movement of the S&P 500 during the month of January sets the stock market trends for the year. If the S&P 500 is up at the end of January compared to the beginning of the month, expect the stock market to rise during the rest of the year.

Another prediction of stock market trends is based upon the Super Bowl indicator. An ‘urban legend”; claiming that if the winning team is from the AFC there will be a down market and if the winning team is from the NFC expect an up market.

Now if this isn’t proof that stock market trends are based upon human behavior, I don’t know what is. Stock market trends are nothing more than the shifting of investor optimism. Since investor optimism is an expression of human emotion, it makes sense that we find clues in stock market trends by observing candlestick patterns.

Japanese Candlesticks is the best technical indicator for predicting stock market trends. The Candlestick Forum helps investors recognize stock market trends by explaining how human weakness creates conditions resulting in predictable patterns. Candlestick signals visually illustrate investor sentiment, as the Homing Pigeon reversal pattern below.

HOMING PIGEON


Description

The Homing Pigeon is the same as the Harami, except for the color of the second day's body. The pattern is composed of a two-candle formation in a down trending market. Both candles are the same color as the current trend. The first body of the pattern is a long body, the second body is smaller. The open and the close of the second day occurs inside the open and the close of the previous day. Its presence indicates that the trend is over.

Criteria

1. The body of the first candle is black; the body of the second candle is black.
2. The downtrend has been evident for a good period. A long black candle occurs at the end of the trend.
3. The second day opens higher than the close of the previous day and closes lower than the open but above the closing price of the prior day.
4. Unlike the Western Inside Day, just the body needs to remain in the previous day's body; where as the Inside Day requires both the body and the shadows to remain inside the previous day's body.
5. For a reversal signal, further confirmation is required to indicate that the trend is moving up.

Signal Enhancements

The higher the second candle closes up on the first black candle, the more convincing that a reversal has occurred.

Pattern Psychology

After a strong downtrend has been in effect and after a long black candle, the bulls open the price higher than the previous close. The shorts get concerned and start covering. The price finishes lower for the day but not as low as the previous day. This is enough support to have the short sellers take notice that the trend has been violated. A strong day after that would convince everybody that the trend was reversing. Usually the volume is above the recent norm due to the unwinding of short positions.

How To Trade The Two Crow

Stock Market Home Study Course - Trading the Two Crows Candlestick Pattern

An investor looking for a stock market home study course is looking for investment training that is simple to understand and easy to implement. Many a stock market home study course does not fulfill that criterion. Investors do not have a firm grip on the information being conveyed. Further expensive training courses are required. A stock market home study course that is simple to understand is the training course for learning candlestick signals. Candlestick signals provide one very simple element. They are visually easy to recognize. The main facet for a stock market home study course should be being able to implement the investment training to successful investing without a multitude of additional courses. Candlestick signals and candlestick analysis utilizes common sense investment practices put into a graphic depiction.

The Japanese Rice traders have produced a number of reversal signals that have proven themselves successful over the past for centuries. The results of the signals are statistically proven. Not by computer backtesting, but with actual profitable results through the centuries. A stock market home study course should provide a proven trading program that is not still in the experimentaiton process. Candlestick signals provide investors with a very clear visual format for when a price reversal is occurring. Utilizing this information becomes a simple visual analysis.

Another element of a stock market home study course should be its application in all market conditions. Candlestick analysis not only provides a trading method for finding individual stocks, it provides an analysis process for projecting the directions on the markets. The information conveyed through the proper use of candlestick signals produces a training platform that allows an investor to exploit profits from all market conditions. The value of any stock market home study course is directly related to the effectiveness of the information provided. Candlestick signals provide high probability investment situations. Learn how to use the signals correctly and you will understand how the professional investors think. You'll be able to exploit profits from the reoccurring emotional trading where most investors lose money.

There are 12 major candlestick signals. Learning those signals well will provide more investment knowledge than most investors will understand in their lifetimes. The remaining candlestick signals are not so important that they need to have a lot of time and effort spent on learning what they mean. However, being able to recognize the signals allows an investor to come back to a reference and get more information on what that signal is conveying. The Two Crows Pattern is part of our trading articles for Candlestick Secondary Signals. While these signals are considered 'secondary' it does not negate the effectiveness of their strong trading potential. They are called 'secondary' because they do not appear as frequently as The Major Candlestick Signals.

TWO CROWS PATTERN


Description

The Two Crows Pattern is a 3-day pattern. It is only a top-reversal pattern. Like the Upside Gap, the Two Crows is a gap pattern, created between the long white candle at the top of an uptrend and the small balck candle at the second day. The black candles gaps open and pulls back before the end of the day. Even though it has pulled back, it did not fill the gap. The third day opens in the body of the small black candle. The Bears maintain the control and move it lower. They are able to fill the gap and close the price within the white candle body. The gap being filled so quickly eliminates any expectations from the bulls.

Criteria

1. A long white candle continues the uptrend.
2. The real body of the next day is black while gapping up and not filling the gap.
3. The third day opens within the second day's body and closes within the white candle's body. This produces a black candle that filled in the gap.

Signal Enhancements

1. If the third day were to close more than halfway down the white candle, it would form an Evening Star Pattern.

Pattern Psychology

After a strong uptrend has been in effect, the atmosphere is bullish. The price gap opens but cannot hold the gains. Before the end of the day, the bears step in and take the price back down. However, the gap up from the white candle was not filled. The next day, the price opens slightly higher, within the body of the previous black candle. The bulls aren't as boisterous and cannot keep the momentum going. Prices head lower and closes in the white candle range. The gap up from the bullish exuberance of the previous day is very quickly wiped away. The further the third day closes into the white candle body, the more bearish the implications.

How To Trade The Unique 3 River Bottom

Practice Stock Trading with Candlestick Chart Patterns

Practice Stock Trading - important advice to novices to the stock market. A great way to practice stock trading is to paper trade. This simulated trading provides great insight without risking any real money while you practice stock trading. There is one caveat to paper trading; play money is very different from real money. While it is wise to practice stock trading before putting your hard-earned bucks on the line, the emotional component is not as intense.

As your finger hovers nervously over the “submit” button to place your first trade, you experience a tightening in your stomach that is oddly exhilarating and yet unsettling. It is amazing how many thoughts go through your mind once you close your eyes, push that button and start watching your trade. “Please, please let this be a good trade” “Maybe I should practice stock trading a bit more, I think I’m going to be sick” “Is my trade running against me already!” “Should I get out now or wait? Maybe I should turn this trade into a long-term hold and wait for it to go back up.” “My wife is going to kill me!” NOW you know why we recommend trading with candlestick charts. Take advantage of the emotional component that all investors experience and see it; Visually depicted in the charts. Japanese Candlestick charting dramatically increases the information conveyed into visual analysis. Each candlestick trading formation clearly illustrates the change of investor sentiment. This process is not apparent in standard bar chart interpretation. Capitalize on the emotional process other investors fall prey to and practice stock trading with candlesticks.

We recommend you begin learning the 12 Major Candlestick Signals - Major in the sense that they occur in price movements often enough to be beneficial in producing a steady supply of profitable trades. Once comfortable with the major signals, expand on your training to include the Secondary signals, which do not occur as often as the Major Signals but are just as effective.

Trading the Unique Three River Bottom Pattern.


Description

The Unique Three River Bottom is a bullish pattern, somewhat characteristic of the Morning Star Pattern. It is formed with three candles. At the end of a downtrend, a long black body is produced. The second day opens higher, drops down to new lows, then closes near the top of the trading range. This is a Hammer-type formation. The third day opens lower but not below the low of the previous day. It closes higher, producing a white candle. But it doesn’t close higher than the previous day’s close. This pattern is a rare pattern.

Criteria

1. The candlestick body of the first day is a long black candle, consistent with the prevailing trend.
2. The second day does a harami/hammer. It also has a black body.
3. The second day’s shadow has set a new low.
4. The third day opens lower, but not below the lowest point of the previous day. It closes higher but below yesterday’s close.

Signal Enhancements

1. The longer the shadow of the second day, the probability of a successful reversal becomes greater.

Pattern Psychology

After a strong downtrend trend has been in effect, the trend is further promoted by a long body black candle. The next day prices open higher but the bears are able to take prices down to new lows. Before the end of the day, the bulls bring it back up the the top end of the trading range. The third day, the bears try to take it down again, but the bulls maintain control. If the following day sees prices going up to new highs, the trend has confirmed a reversal.

How To Trade The Matching Low

Stockmarket Charting Techniques

The best stockmarket charting method is candlestick signals and patterns. There are a number of available stockmarket charting tools but candlestick signals are the quickest to learn. Considering the amount of time required to learn to read stockmarket charts why not choose to accelerate your education process with Japanese Candlestick charts.

Charting, or ‘technical analysis’, involves interpreting the performance of stocks, currencies, commodities, and other financial data. The analysis of past performance should quickly identify signals or patterns to assist the investor on future price potential. That is why we focus on Japanese Candlesticks for a quick visual depiction of price projections based upon proven patterns.

Using Candlestick Signals easily tells investors which stockmarket charts are poised for strong moves and which may remain relatively flat during the current market. Once an investor has identified these trades, it is a shorter process of elimination to determine which trade offers the best possible rate of return.

Stop contributing to the purses of the professional money managers! Quit being on the wrong side of the trade. Don’t believe in the Holy Grail of trading strategies.
Keep it simple – learn the 12 Major Candlestick Signals for reading stock chart patterns. You don’t need to hunt for ‘secret’ trading techniques. Professionals have used the Japanese Candlestick signals for many years to determine the stockmarket. We provide page, upon page, of free signal examples and trading criteria. Additionally, Stephen Bigalow provides a free weekly Webinar to continue his commitment to the Candlestick Community.

MATCHING LOW


Description

The Matching Low pattern is similar to the Homing Pigeon patter, the exception being that the two days of the pattern close on their lows, at the same level. After a long downtrend, recognizing that the price has closed at the same level without going through is an indication to the bears that the bottom has been hit.

Criteria

1. The body of the first candle is black; the blody of the second candle is black.
2. The downtrend has been evident for a good period. A long black candles occurs at the end of the trend.
3. The second day opens higher than the close of hte previous day and closes at the same close as the prior day.
4. For a reversal signal, further confirmation is required to indicate that the trend is moving up.

Pattern Psychology

After a strong downtrend has been in effect and after a long black candle, the bulls open the price higher than the previous close. The shorts get concerned and start covering. However, the bears sitll have enough control to close the price at the low of the day, the low being the same as the close of the previous day. The psychological impact for hte bears is that it couldn't close below the previous close, thus causing concern that this is a support level.

How To Trade The Belt Hold

Stock Market Investing Guide Should Incorporate Candlestick Signals

What is the best stock market investing guide? An investment method that has common sense investor intelligence built in. This is exactly what the candlestick signals provide. Most investors do not have a stock market investing guide. They will try anything that promotes high profit results. They move from one technique to the next not ever finding an investing technique that works. What should be used as a stock market investing guide? A technique that is proven. A technique that can be easily learned.

A technique that once you have learned it, can be applied to any trading market or any market conditions.

Candlestick signals are the cumulative knowledge of everybody that is buying and selling a trading entity in a specific timeframe. The Japanese Rice traders not only identified the change of investor sentiment in a trend, being able to pinpoint the reversals of a trend, they also learned what the investor sentiment was doing to create that reversal. This information becomes very powerful for the investor. If an investor has a stock market investing guide that not only illustrates when to buy and when to sell, but also educates the investor as to why they are buying and selling, this provides the knowledge to successfully trade any market.

Learn how to use candlestick signals correctly. Having the ability to understand why the signals work creates the investment knowledge to give an investor full utilization of their investment abilities. The major signals have powerful implications. The secondary signals also provide valuable information. Using the signals as a stock market investing guide will provide a comprehensive investment format. An investor can apply candlestick signals as the basis for any other trading technique. Learning the candlestick signals allows the investor to gain insights into market trends that are not available with any other trading techniques.

This week's signal - Trading the Belt Hold Pattern - Reversal Signal

BELT HOLD


The Belt Hold lines are formed by single candlesticks. The Bullish Belt Hold is a long white candle that has gapped down in a downtrend. From it’s opening point, it moved higher for the rest of the day. This is called a White Opening Shaven Bottom or White Opening Maruboza. The bearish Belt Hold is just the opposite. It is formed with a severe gap away from the existing uptrend. It opens at it’s high and immediately backs off for the rest of the day. It is known as a Black Opening Shaven head or Black Opening Maruboza. Yorikiri, a sumo wrestling term, means pushing your opponent out of the ring while holding onto his belt. The longer the body of the Belt Hold, the more significant the reversal.

Criteria

1. The candlestick body should be the opposite color of the prevailing trend.
2. It significantly gaps open, continuing the trend.
3. The real body of the candlestick has no shadow at the open end. The open is the high or low of that trend.
4. The length of the body should be a long body. The greater the length, the more significant the reversal signal.

Signal Enhancements

1. The longer the body, the more significant the reversal pattern.

Pattern Psychology

After a strong trend has been in effect, the trend is further promoted by a gap open, usually a large gap. The opening price becomes the point where the price immediately moves back in the direction of the previous close. This makes the opening price the high or the low for the trend. This causes concern. Investors start to cover shorts or selling outright. This starts to accentuate the move, thus reversing the existing trend.

How To Trade The Tri Stars

Technical analysis stock tutorials - Trading the Tri-Star Pattern

Technical analysis stock tutorials provided by The Candlestick Forum. This is part of our ongoing training for technical analysis stock tutorials for trading candlestick charts and candlestick patterns. We hope you are benefiting from the weekly additions of these secondary candlestick chart patterns and encourage you to check back often. For a complete list of all the technical analysis stock tutorials in our site you will want to begin with The Major Candlestick Signals (click here.)

Tri Star Pattern


Description

The Tri Star pattern is relatively rare. However, it is a very significant reversal indicator. It is comprised of three Dojis. The three-day period illustrates indecision of a period of days.

Criteria

1. All three days are Dojis.
2. The middle day gaps above or below the first and third day. The length of the shadow should not be excessively long, especially when viewed at the end of a bullish trend.

Signal Enhancements

1. The greater the gap, away from the previous days close, sets up for a stronger reversal move.
2. Large volume on one of the signal days increases the chances that a significant reversal is taking place.

Pattern Psychology

After an up-trend or a downtrend has been in effect, the appearance of the first Doji reveals that there is now indecision in the bull’s and the bear’s camp. The next day gaps in the same direction as the existing trend and forms the second Doji. This reveals that no certainty for either direction has become apparent. The third day opens opposite the previous trends direction and forms another Doji that day. The final Doji is the last gasp. Any investor that had any conviction is now reversing their position. Because of the rarity of this pattern, double-check the data source to confirm that the Dojis are not bad data.

How To Trade The Ladder Bottom

Commodity Trading Trend Identified with Candlestick Reversal Signals

A commodity trading trend incorporates elements that make commodity trading easier than stocks. A commodity trading trend usually moves with more consistency than that of a stock trend. The reason is very simple. A commodity trading trend is usually influenced by very few factors. These factors are usually supply and demand or weather. Candlestick signals clearly define when investor sentiment is reversing in a commodity trading trend. Keep in mind, the candlestick signals were successfully developed in the most basic of commodity, RICE.

Stock trends are influenced by many factors not directly related to the stock price itself. The market movement in general, interest rates, crude oil prices, and many other outside influences can change the direction of a stock price. A commodity trading trend is directly influenced by demand outpacing supply or vice versa. The demand versus supply can be clearly illustrated by the reversal signals in candlestick signals. Investor sentiment is directly affected by price. Candlestick signals become a very strong indicator for illustrating when investors anticipate the price is now meeting the demand requirement. This change of investor sentiment creates clear candlestick reversal signals. A commodity trading trend will show the same investor changes repeatedly.

Learn to recognize the candlestick signals. It becomes extremely useful to have this knowledge for recognizing a change in a commodity trading trend as well as a stock trading trend. Although a stock trading trend may be more difficult to read as far as consistency, the candlestick signals still produce a high probability trend analysis. Each signal has been fully analyzed by Japanese Rice traders for centuries. This is the purest form of statistical analysis. The benefit of the candlestick signals is that they are actual working signals that have been utilized successfully. Having the knowledge that is incorporated in each of the reversal signals provide the investor with a huge advantage for trend analysis. An example of a trend reversal is outlined below in the "ladder bottom'.

LADDER BOTTOM


Description

The downtrend is finishing with four consecutive black candles, each closing lower than the previous day. The fourth day is different. It opens and trades higher during the day, even though it closes the day on the low. The next day opens higher than the open of the previous day, a gap up, and continues to head up all day. The final day of the signal closes higher than the trading range of the past three days.

Criteria

1. Like the Three Black Crows pattern, the beginning of the signal has three black candle days, each with lower opens and locses of the previous day.
2. The fourth day resembles a reverse hammer, opening, then trading up during the day before closing on its low.
3. The final day opens above the open of the previous day open, a gap up and continues upward for the rest of the day, a Kicker-type pattern. It finally closes above the trading range of the previous three days.

Pattern Pasychology

After a strong downtrend has been in effect for a while, there is a day when prices ty to climb back up to the previous day's high. This gets the bears attention even though it closes on the low that day. When it opens up much higher the next day, the bears start scrambling to cover and the bulls start taking control. If volume increases noticeably on the final day, that will be a good indication that the bulls and the bears have exchanged their positioning.

How To Trade The 3 Inside Down

Candlestick Patterns Provide Excellent Stock Market Trading Tools

When deciding on which stock market trading tools to use for trading your own portfolio - Nothing beats Candlestick Signals! Stock charts displayed in bar chart formats are difficult to interpret and frustrating to investors new to the stock market. Even if you are unfamiliar with reading stock charts, Candlestick Charts provide clear and easy to identify patterns. Reading about the Japanese Candlestick signals is interesting and it aids in remembering profitable pattern setups. The Candlestick Forum presents stock market trading tools that help investors read stock charts and recognize dependable trading patterns. These patterns produce predictable results which are easily combined with other technical analysis tools. Stock market trading tools do not have to be difficult, especially if you begin with Candlestick Charts.

Three Inside Up and Three Inside Down


Description

Note that after the long candle day that is in the same direction of the trend that the Harami pattern occurs. The Harami is the first indication that the trend has stopped. The third day confirms that the harami has indicated correctly. The three-day pattern is a modern era confirmation of the Harami pattern.

Criteria

1. The Harami pattern is the overriding signal component of this pattern.
2. The harami body should be the opposite color of the long candle day.
3. Day three has a close that is higher than the open of day one.(Three Inside Up) Or lower than day one in the bearish indication.(Three Inside Down)

Pattern Psychology

After a trend and the occurrence of a long body day that extends that thread, the harami pattern shows that the trend has stopped. A factor that helps identify the strength of the reversal is how big the harami is compared to the previous day's body. A body that is relatively large indicates more strength in the opposite direction. Additionally, the magnitude of the strength in day three adds to the potency of the reversal.

How To Trade The 3 Starrs ITS

Stock Market Information Websites - Don't Become Overwhelmed

There are over 75 million pages on the internet covering Stock Market Information Websites. Where do you begin? Naturally, The Candlestick Forum believes we can deliver the goods! With so many stock market information websites to review, new investors could spend months sorting through the hype. That is why The Candlestick Forum provides free stock market information for both the new and experienced investor interested in quickly learning how to read stock charts. Investors’ easily learn to identify common buy and sell signals with candlestick charts. We offer ‘printable’ pages for your reference for trading all the major signals, the secondary signals (also, called reversal signals), and Continuation Patterns. Each week we add a new trading signal to our website and encourage you to check back often to gradually continue your stock market information training.

We also list several stock market information websites to alert our readers to other websites. Unlike many stock market information websites, we do NOT participate in irrelevant link exchanges that end up taking you on a wild goose chase. A member of our staff has personally reviewed each site. We are certain Candlestick Signals and Patterns are the basis for successful trading. Become comfortable reading stock charts and then expand your education by combining the Japanese Candlestick Techniques with Western techniques. Review our recommended reading and Other Recommended Stock Market Information Websites.

THREE STARS IN THE SOUTH


Description

The slow down of the trend is visually obvious. The opposite signal pattern is the Advance Block pattern. The long black body at the end of a downtrend is the first portion of this pattern. The shadow indicates that some buying had presented itself. The next day reveals a deterioration of the selling. The third day is a Marubozu, no shadows. A bullish day following this pattern is good confirmation that the downtrend fizzled and reversed.

Criteria

1. The first black candle day has a lower shadow that indicates buying stepping in. Almost a Hammer but not quite.
2. The second day is like the first but on a smaller scale.
3. Day Three should be a Marubozu, no shadows. It is within the previous day’s trading range.

Pattern Psychology

After a down trend, the daily formations start indicating that buyers are becoming evident. The second day indicates the same message on a small scale. Day three brings movement to a slow process. The bears should now be concerned about their positions. New lows are diminishing rapidly. This gives enough time for the short sellers to start covering their positions.

How To Trade The 3 Identical Crows

Stock Market Movers or Stock Market Stinkers?

Stock Market Movers
– don’t get me on a rant! I tried to find relevant advice for finding these gems of the market. Instead, I found a plethora of websites proudly displaying nothing, zip, nada to assist an investor on furthering their education. Please, just a little tidbit that evenly remotely relates to stock market movers would be nice! But NO, the ever increasing familiar lists of everything from Art to Sports and how did anyone work in Stock market movers into a Home and Garden website. Somebody help me! I’ve experienced the same frustration of the rest of the internet community and this website continues to provide FREE, on-going, training materials to help anyone find stock market movers with high profit potential.

Stock Market Movers are easier to spot with candlestick patterns. Stock research for finding stock market movers can become very complex. However, the trained candlestick investor sees the familiar candlestick patterns and immediately knows whether a specific stock pattern merits any further of his time and attention. Some so-called stock market movers turn out to be stock market stinkers! You can surf the net looking for stock market movers or you can spend your time learning candlestick signals. My vote is obvious, check our website each week, we promise to continue to deliver new training material. Learn the Candlestick Signals. Below is a favorite pattern, which demonstrates some very anxious sellers.

Trading the Three Identical Crows Pattern


Description

The Three Identical Crows have the same criteria as the Three Black Crows. The difference is that the opens are at the previous day's close


Criteria

1. Three long black bodies occur, all of close to equal lengths.
2. The prior trend should have been up.
3. Each day opens at the close of the previous day.
4. Each day closes near its low.

Pattern Psychology

After an uptrend a long black candle forms. However, the selling is more sever. There do not appear to be any buyers at the next day's open. The long black candles, having a stair-stepping pattern to them, indicates a much greater motivation to get out of the position

How To Trade 3 Black Crows

Stock market investing 101 - Simplified utilizing candlestick signals

Stock market investing 101 should include as easy a process to learn the stock market as possible. Candlestick signals incorporating common sense investment practices meet those criteria. Stock market investing 101 is a process that should allow investors to understand why prices move. The psychology incorporated into candlestick signals makes understanding what is going on in an investor's mind very easy to analyze. The signals were created through hundreds of years of visual analysis and interpretation by successful Japanese Rice traders.

Most stock market investing 101 courses want to include fundamental reasons for why prices move. MBA's graduate every year with the concept if you can read a strong balance sheet, the price will move. One of the biggest misconception of investing is anticipating prices to move based upon fundamental reasons. The first lesson of stock market investing 101 should be that prices move based upon the "perception" of fundamental reasons. The Japanese Rice traders discovered this many centuries ago. Why do prices go down when good news is announced? Because the anticipation of that good news was already built into the stock price.

Candlestick signals are formed based upon the investor sentiment that indicates a change. Use this information to your advantage. You may not have a research staff or access to extensive research, but you can take advantage of the information conveyed in candlestick signals. Why do candlestick buy signals occur at the bottom? Because the smart money is anticipating what the future potential is for the price. That future potential may be good news. The prospect of favorable news is what makes the smart money buy when everybody else is selling. The announcement of the good news is what makes the smart money sell at the top when everybody else is buying. That information is conveyed through numerous candlestick signals.

Trading The Three Black Crows Pattern


Description

The Three Black Crows got their name from the resemblance of three crows looking down from their perch from a tree. The signal, occurring after a strong uptrend, indicates the crows looking down, or lower prices to come. This pattern is the opposite of the Three White Soldiers.

Criteria

1. Three long black bodies occur, all of close to or equal length.
2. The prior trend was up.
3. Each day opens within the body of the previous day.
4. Each day closes near its low.

Pattern Psychology

A long black candle forms after an uptrend. This uptrend has now reached levels where the sellers have started to step in. The first long black candle body is followed by two more long black candles. Each having opened in the previous day's body, indicating that buying was occurring early each day but the Bears kept forcing prices down by the end of the day. This consistent process of selling provides a stronger downtrend potential versus a rapid overselling period.

How To Trade The Breakaway

Commodity trading course not required with candlestick signals

A commodity trading course is not needed when utilizing candlestick signals. What can be taught in a commodity trading course? An investor only needs to understand what makes commodity prices move up or down. Candlestick signals clearly demonstrate when prices are going higher, or going lower. A commodity trading course can not provide a platform for analyzing what prices are going to do. What makes commodity prices move? Supply and demand! A commodity trading course will not be able to produce the insights to trade successfully. Candlestick signals produce the format for detecting changes in investor sentiment.

Where do investors learn how to trade commodities? There is not a commodity trading course available in institutions of higher learning. An investor needs a platform for detecting when to buy and when to sell. The Japanese Rice traders developed the most basic and accurate method for producing high profits in commodity trading. They traded the most basic of commodities, Rice. The information that is conveyed in a candlestick signal is much more important than trying to analyze the fundamental conditions of a commodity price. The big money, 'smart money,' can be seen establishing their positions based upon what the candlestick signal formations reveal.

Utilize the simple information that is conveyed in a candlestick signal. Each signal has been analyzed for hundreds of years. Not only does that analysis include visual recognition of a reversal in a commodity price trend, the Japanese Rice traders were able to evaluate what the investor sentiment was doing to create the reversal signal. Learn to use the candlestick signals correctly and understand the information that each signal provides and you will have a huge investment advantage. This is not difficult analysis. Each candlestick signal illustrates what investors were thinking at important reversal points. When this knowledge can be seen in a graphic formation, the probabilities of being in the correct trade at the correct time increases dramatically.

This week's featured Candlestick Pattern -

The Breakaway Pattern


Description

If a trend has been evident, the breakaway pattern, whether bullish or bearish initially indicates the acceleration of that trend. The pattern starts with a long candle representing the current trend. The next candle gaps away from the long candle with the color of that candle the same as the long candle. The third day can be either color. It will not show a change in the trend. The fourth day continues the trend, having the same color as the trend. The fifth day reverses the trend. It opens slightly opposite of the way the trend has been running. From there, it continues in the same direction to where it closes in the gap area.


Criteria

1. The first day is a long-body day has the color of the existing trend.
2. The second day gaps away from the previous close. It has the same color as the first day candle.
3. Day three and four have closes that continue the trend.
4. The last day is an opposite color day that closes in the gap area between day one and day two.

Pattern Psychology

After a trend, usually in an overbought or oversold area, a long candle forms. The next day they gap the price further. That day has the same color as the trend. For the next two days, the bulls and/or bears keep the trend going in the same direction, but with less conviction. The final day, the move goes opposite the existing trend with enough force to close in the gap area between day one and day two. This day completely erases the move of the previous three days.

How To Trade The CB Swallow

Candlestick Patterns Provide the Best Technical Analysis Tools

If you want the Best Technical Analysis Tools then you need to learn the simplicity of Japanese Candlesticks!!

The Candlestick Forum strives to provide the best technical analysis tools available over the internet. Stephen W. Bigalow, author of "High Profit Candlestick Patterns", explains the history and profitable trading techniques for the best technical analysis tools -- Japanese Candlesticks --for centuries of proven profitable results.

Even investors new to trading, quickly identify price movements with a high degree of accuracy. due to the simplicity of candlesticks. Trading the stock market requires a great degree of discipline. Ask any trader what is the biggest obstacle they had to overcome. Repeatedly, the answer is letting go of a bad trade. Even the best technical analysis tools can not help you fight the urge to hold onto loosing trades. Candlestick Signals remove the emotional trading that cause good trades to go bad.

The best technical analysis tools provide quick and easy methods for identifying price reversals, strong trends, weakening trends, and chart patterns ready to put money in your pocket. The 12 Major Candlestick Signals provide the best technical analysis tools you will ever need! Be sure to follow our Free Resources area for all the trading explanations of:

Major Candlestick Signals, These 12 Major Signals provide more profitable trades than most investors will ever need. However, it does not mean the remaining patterns should not be considered.

The Candlestick Continuation Patterns, Identify periods of 'rest' in a trading entity. The Japanese insight is, 'there are times to buy, times to sell, and times to rest." Learning these continuation patterns will help investors know to place their money elsewhere.

Finally, the Candlestick Reversal Signals, are highly effective patterns for identifying price reversals. An important element to any portfolio is the ability to identify when it is time to take profits, or close poor performing trades.

This week we add the "Concealing Baby Swallow" for identifying reversal of a downtrend.

CONCEALING BABY SWALLOW


Description

The first two days of the signal, two Black Marubozus, demonstrate the continuation of the downtrend. The third day, the Reverse Hammer illustrates that the downtrend is losing steam. Notice that it gapped down on the open, then traded up into the previous days trading range. This demonstrated buying strength. The last day opens higher and closes below the previous days close. It completely engulfs the whole trading range of the prior day. Although the trading ended at the trends low point, the magnitude of the downtrend had deteriorated significantly. Expect buying to show itself at these levels. This is a very rare signal.


Criteria

1. Two large Black Marubozus make up the beginning of this pattern.
2. The third day is a Reverse Hammer formation. It gaps down from the previous day’s close.
3. The final day completely engulfs the third day, including the shadow.


Pattern Psychology

The bears have been in control for awhile. At the end of a downtrend, two Black Marubozu days appear. The third day gaps down at its low, then trades up into the trading range of the previous day. This buying is then negated by the sellers stepping back in. However, the bears have taken notice of the buying that occurred. The final day opens higher, again causing much concern for the sellers. As it sells off for the rest of the day, the concerned shorts have time to cover their positions. The new closing low is not of the same magnitude of the previous down days of the trend. The buyers do not run into very much selling resistance from here.

Sabtu, 30 Oktober 2010

How To Trade The Meeting Lines

Candlestick Stock Chart Patterns are the most reliable method for trading the markets

Stock chart patterns have been utilized in the stock market for centuries. These recurring stock chart patterns create a huge advantage for technical investors by assisting them in identifying pattern trends. Depending upon the stock chart patterns, the pattern representation alerts traders to short term trend reversals, continuation patterns, market tops, false breakouts, and potentially explosive moves in price. Stock chart patterns continue to gain popularity in the trading community due to their ability to predict price movements. It is no surprise that many of the new stock market charting programs include search parameters identifying candlestick patterns. Serious investors recognize the value of candlestick stock chart patterns and benefit from the message each signal conveys. These patterns reflect group behavior behind price movement and provide valuable insight.

Take the mystery out of stock chart patterns and learn to trade with Japanese Candlesticks. Each week we add a new article focusing on a specific candlestick pattern and unravel the secret behind upcoming price moves.

This week’s signal – Trading the Meeting Lines – A Candlestick Reversal Pattern.

MEETING LINES


Description

Meeting Lines (or Counterattack Lines) are formed when opposite colored bodies have the same closing price. The first Candlestick body is the same color as the current trend. The second body is formed by a gap open in the same direction as the trend. However, by the close, it has come back to the previous day's close. The Bullish Meeting Line has the same criteria as the Piercing Line except that is closes the same close as the previous day and not up into the body. Likewise, the Bearish Meeting Line is the same as the Dark Cloud pattern, but it does not close down into the body of the previous day.

Criteria

1. The first candlestick body should continue the prevailing trend.
2. The second candlestick gaps open continuing the trend.
3. The real body of the second day closes at the close of the first day.
4. The body of the second day is opposite color of the first day
5. Both days should be long candle days.

Signal Enhancements

1. The longer the bodies, the more significant the reversal pattern.

Pattern Psychology

After a strong trend has been in effect, the trend is further promoted by a long body day. The exuberance is increased the second day with a gap in the same direction. But before the end of the day, the price has come back to the same closing price of the previous day. This indicates that the other sid eof the market has now stepped in. Another day, opposite of the predominant trend is required to demonstrate that the trend has reversed. The opposite colored body does not need to be a long as the first body. In every case, a confirmation day is going to be needed. The pattern has more strength if there are no shadows at the meeting point.

How To Read Stock Charts

Learn how to read stock charts

Reading charts is an art form that can take years to fully master. Why do we read charts? Because, by reading charts, we can determine what the "big money" is doing!

You have to be able to analyze a chart and come to a conclusion about whether or not to risk your hard earned money on a trade.

That is really the bottom line.

And this is what separates the novice trader from the professional. There are several factors on a chart that make it worthy of trading. By analyzing these factors, we can determine with high probability which direction a stock will move.

There several questions that you want to ask yourself when you look at a stock chart. Here they are...

* What stage is this stock in?
* Is this stock in and uptrend or a downtrend?
* Is the stock at the beginning, middle, or end of the trend?
* How strong is the trend?
* Where are the trend lines?
* What wave is this stock in?
* What do the moving averages tell me?
* Was there a breakout recently?
* Is the chart "smooth" or "sloppy"?
* Are there any chart patterns?
* Are there wide range candles in the direction of the trend?
* Are there any gaps in the direction of the trend?
* Are professionals selling strength or buying weakness?
* Where are the support and resistance areas?
* Is this stock at a Fibonacci level?
* What does volume tell me?

I know it seems like a lot of information to try and keep track of but all of the above questions are essential to chart reading mastery! Now, copy and print out that list of questions and keep it handy next to your computer. Make several copies so that you can check off and make notes as you analyze your next chart.

Go ahead, I'll wait...

Got it printed out? Great! Now you won't forget anything important when it's time to analyze a chart for your next trade. In the heat of battle, when emotions are running high, it is very easy to forget to look for some of the most basic things on a chart. I've done it. That is, until I made this list!

Ok, now let's go through the list one by one to make sure that you know how to answer the questions correctly. Don't worry, with practice, you will not even need to think about these things. It will become automatic.

You will be able to read charts with lightning fast speed. In just a couple of seconds you will be able to glance at a chart and know all the answers to the questions above.

Stages, Trends, and Waves

Let's look at an example chart...


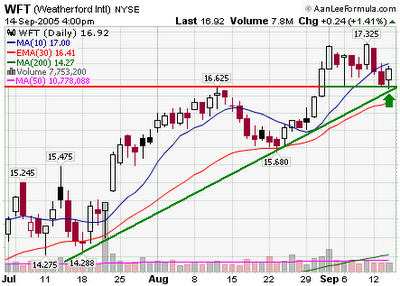
Nice chart! This stock broke out through a consolidation in July and now it is in a nice strong trend. The green arrow is the day on which we see this stock. So, what questions can we answer just from glancing at this chart?

This stock is in stage two.

You remember the stages right? Stage one is a consolidation, stage two is an uptrend, stage three is another consolidation, and stage four is a downtrend. This stock was in a stage one in July but at the end of July, it broke out into a stage two. It is currently still in a stage two.

This stock is in an uptrend.

This is the easy part. If a stock is heading toward the upper right corner of a chart then it is in an uptrend! For some reason, this tends to elude some traders!

This stock is near the middle or end of the trend.

How do we know that? The breakout signals the start of the trend. There has already been one significant pullback. Had we bought stock on the first pullback, then we would have concluded that we are at the beginning of the trend. But since this is the second pullback, then we know that this trend may not last much longer.

This stock is in a strong trend.

The ADX indicator (not shown) is near 30 which we consider to be a fairly strong trend. The higher the ADX, the stronger the trend. This stock is at the lower trend line. You can see by the thick green line that this stock has hit the lower trend line. You can draw the trend lines in manually, but after you have been trading for awhile, you will not need to draw them. You will be able to see them automatically.

This stock is in the fourth wave.

In Elliott Wave theory, a stock goes through 5 waves in an uptrend. In the chart above, the first wave after the breakout is wave 1. The first pullback is wave two, the next wave up to $17.33 is wave three, and the pullback that we are in now is wave four. There is one more wave to go!

Conclusion

Now we have identified that the possible future direction of this stock is up. Nothing is ever certain in the stock market! However, by looking at this chart we can be certain that the probabilities are on our side for a continued move to the upside.

After you finish reading this tutorial, run your scans and go through some charts. Try to identify the various factors mentioned above. Just understanding the nature of stocks and the different stages, trends and waves that all stocks go through will greatly improve you trading. Soon, all of this direction analysis will become second nature. You won't even have to think about it.

Were not done yet!

Swing Trading Gaps

How to trade gaps on a stock chart

Are all gaps created equal? Nope. There are really only two significant factors to consider when trading gaps.

You have to be able to identify if the gap is caused by professional traders or amateur traders. There is a big difference between the two!

Wait a minute...let's back up a second...

What is a gap?

A gap is defined as a price level on a chart where no trading occurred. These can occur in all time frames but, for swing trading, we are mostly concerned with the daily chart.

A gap on a daily chart happens when the stock closes at one price but opens the following day at a different price. Why would this happen? This happens because buy or sell orders are placed before the open that cause the price to open higher or lower than the previous day's close.

Here is an example:

Let's say that on Tuesday, Microsoft closes at $26.57. After the close they come out with their earnings report. They report higher than expect earnings that causes excitement among investors. Buy orders come flooding in. The next day Microsoft opens at $27.60. Since there were no trades between $26.57 and $27.60 this will create a gap on the chart.

Let's look at a chart:


You can see on the chart above that the stock closed at one price and then the next day the stock "gapped up" creating a price void on the chart (yellow circle).

Filling The Gap

"In Japanese Candlestick Charting gaps are referred to as windows. When we say that a stock is "filling a gap", the Japanese would say that the stock is "closing the window".


Sometimes you will hear traders say that a stock is "filling a gap" or they might say that a stock has "a gap to fill".

Are you wondering what the heck they are talking about?

They are talking about a stock that has traded at the price level of a previous gap. Here is a chart example:


In this example, you can see that the stock gapped down. A few days later it rallied back up and filled in the price level at which there were previously no trades. This is known as filling the gap.

Sometimes you will hear traders saying that "gaps always get filled". This just simply isn't true. Some gaps never get filled, and sometimes it can take years to fill a gap. So I really don't even think it is worth debating because it offer no edge one way or another!

Types Of Gaps

Traders have labeled gaps depending on where it shows up on a chart. It isn't really necessary to memorize all of these patterns but here is the breakdown so that you can impress your trading friends.

* Breakaway Gaps - This type usually occurs after a consolidation or some other price pattern. A stock will be trading sideways and then all of sudden it will "gap away" from the price pattern.
* Continuation Gaps - Sometimes called runaway gaps or measuring gaps, these occur during a strong advance in price.
* Exhaustion Gaps - This type of gap occurs in the direction of the prevailing trend and represents the final surge of buying or selling interest before a major trend change.

Ok, now we are going to get into the really good stuff...

Professional vs. Amateur Gaps

When you are looking at gaps on a stock chart, the most important thing that you want to know is this:

Was this gap caused by the amateur traders buying or selling based on emotion?

Or...

Was this gap caused by the professional traders that do not make emotional decisions?

To figure this out you have to understand this one important concept first. Professional traders buy after a wave of selling has occurred. They sell after a wave of buying has occurred.

Amateur traders do the exact opposite! They see a stock advancing in price and are afraid that they will miss out on the move, so they pile in - just when the pro's are getting ready to sell.

Here is an example of a gap caused by amateur traders...


See how this stock gapped up after a wave of buying occurred? These amateur traders got emotionally involved in the stock. They piled in after an already extended move to the upside.

These traders eventually lost money as the stock sold off over the next few weeks. Notice how the stock eventually did go back up - but only after a wave of selling occurred (professional buying).

Here is another chart:


See how this stock gapped down after a wave of selling occurred? These amateur traders got emotionally involved in the stock. They sold after an already extended move to the downside.

Ok, so let's break this down, shall we?

* If a stock gaps up after a wave of buying has already occurred, these are amateurs buying the stock - look to short.
* If a stock gaps down after a wave of selling has already occurred, these are amateurs selling the stock - look to go long.

These types of gap plays usually provide great opportunities because they represent and extreme price move.

Well, there you have it...a short primer on trading gaps.

Gaps can provide nice swing trading profits but they can be a little more tricky to trade. The advantage is that you can sometimes make big profits, quickly, and with a little less risk...

...something every trader should strive for.